
%202.jpg)

Analysis with the Data Grid


Analyzing across participants is often where the most valuable insights emerge, and where many teams lose the most time. The data grid replaces manual spreadsheets with structured, evidence-linked comparison.
In this lesson of our AI Insights & Analysis course, you’ll learn:
- How to understand the data grid layout
- How to use the data grid to identify themes and outliers
- When and how to export the data grid if necessary
Understanding the data grid layout
Traditionally, cross-participant analysis means copying notes into spreadsheets, aligning responses manually, color-coding themes, and constantly jumping back to transcripts to double-check context. It works, but it’s slow, fragmented, and easy to lose nuance along the way. The data grid saves you hours of manual work compared to analysis with spreadsheets, and keeps your insights connected to real evidence.
The data grid is designed to feel intuitive, while keeping every insight directly connected to source material. It’s laid out as follows:
- Rows represent an individual participant in your project
- Columns display discussion topics, generated from your discussion guide.
- Cells contain AI-generated observations with clickable citations.
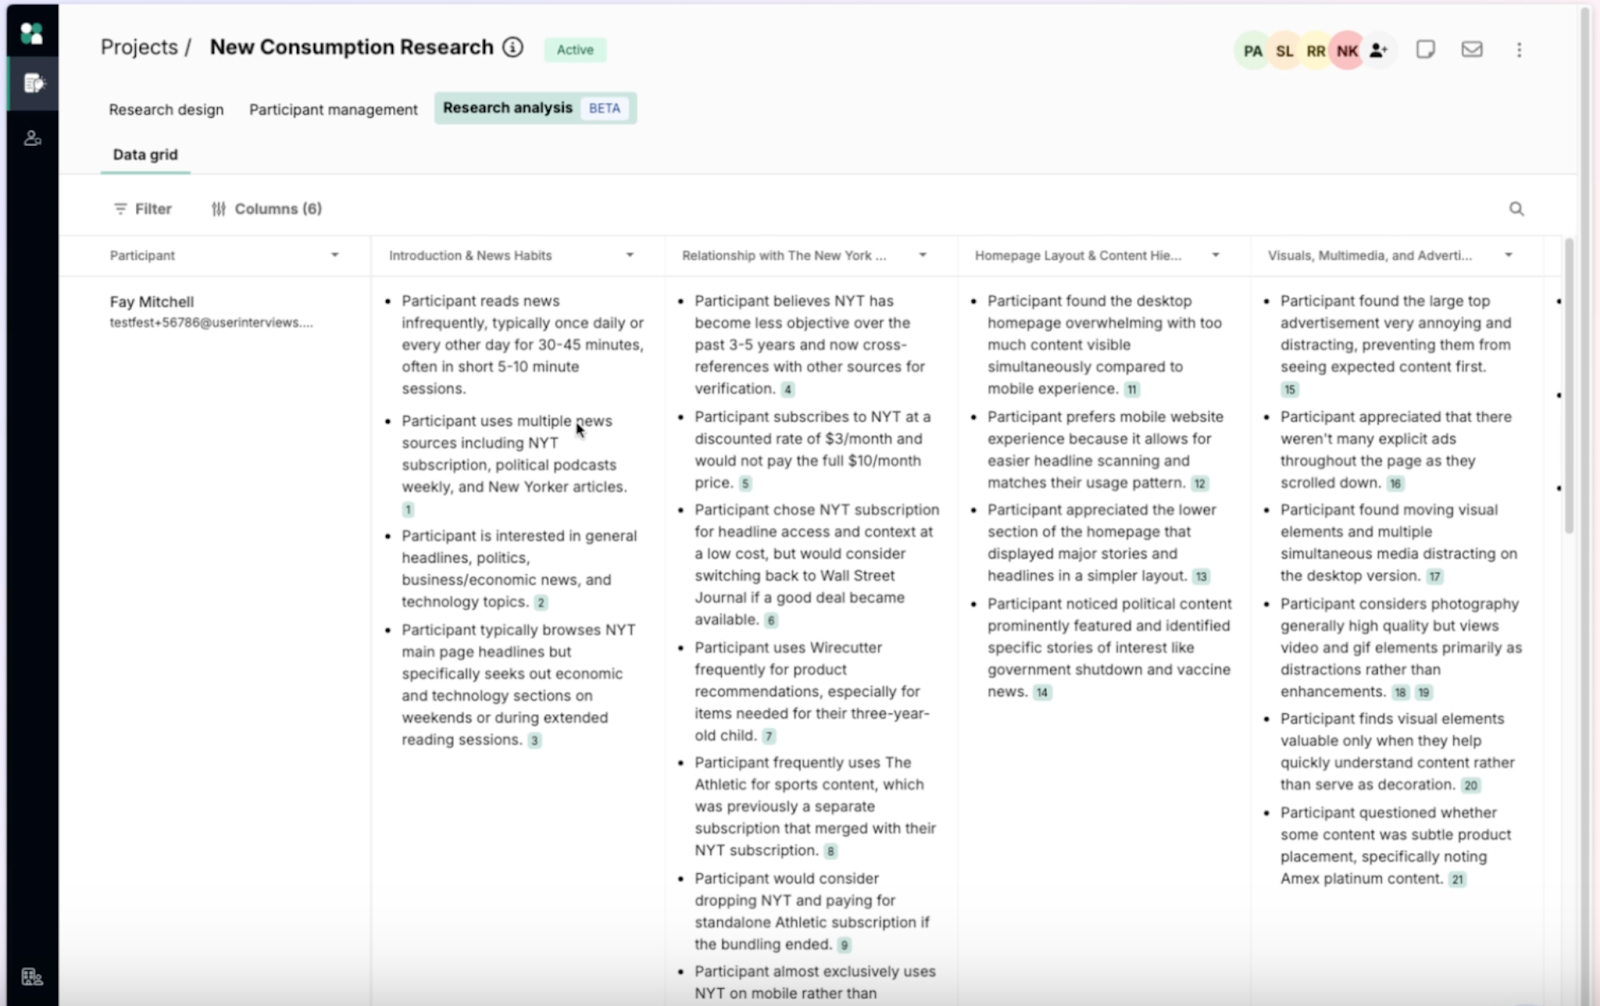
As sessions complete, the grid updates automatically. You can use the grid to scan a topic column to identify themes, spot outliers or contradictions, or validate patterns by jumping to source quotes. Because everything is linked back to transcripts, it’s easy to confirm accuracy.
Tips for data grid analysis
Comparing responses across participants
Once your sessions are complete, this is where synthesis begins.
Start by scanning vertically down a column (one topic at a time), and ask yourself:
- Do multiple participants describe the same pain point?
- Are there strong emotional reactions?
- Is there alignment — or disagreement?
This method helps you move from: “What did this one participant say?” to “What are we seeing across the cohort?”
💡 Tip: Focus on one topic at a time rather than reading row by row. This mirrors how themes naturally emerge.
Identifying themes and outliers
The Data Grid makes it easier to spot themes (such as repeated frustrations, shared language across participants, similar behavioral patterns, and consistent motivations or barriers) and outliers (such as strong disagreement with the majority, unique edge-case workflows, unexpected enthusiasm or resistance, and segment-specific differences).
Outliers are often just as valuable as dominant themes, especially when tied to specific personas or screener criteria.
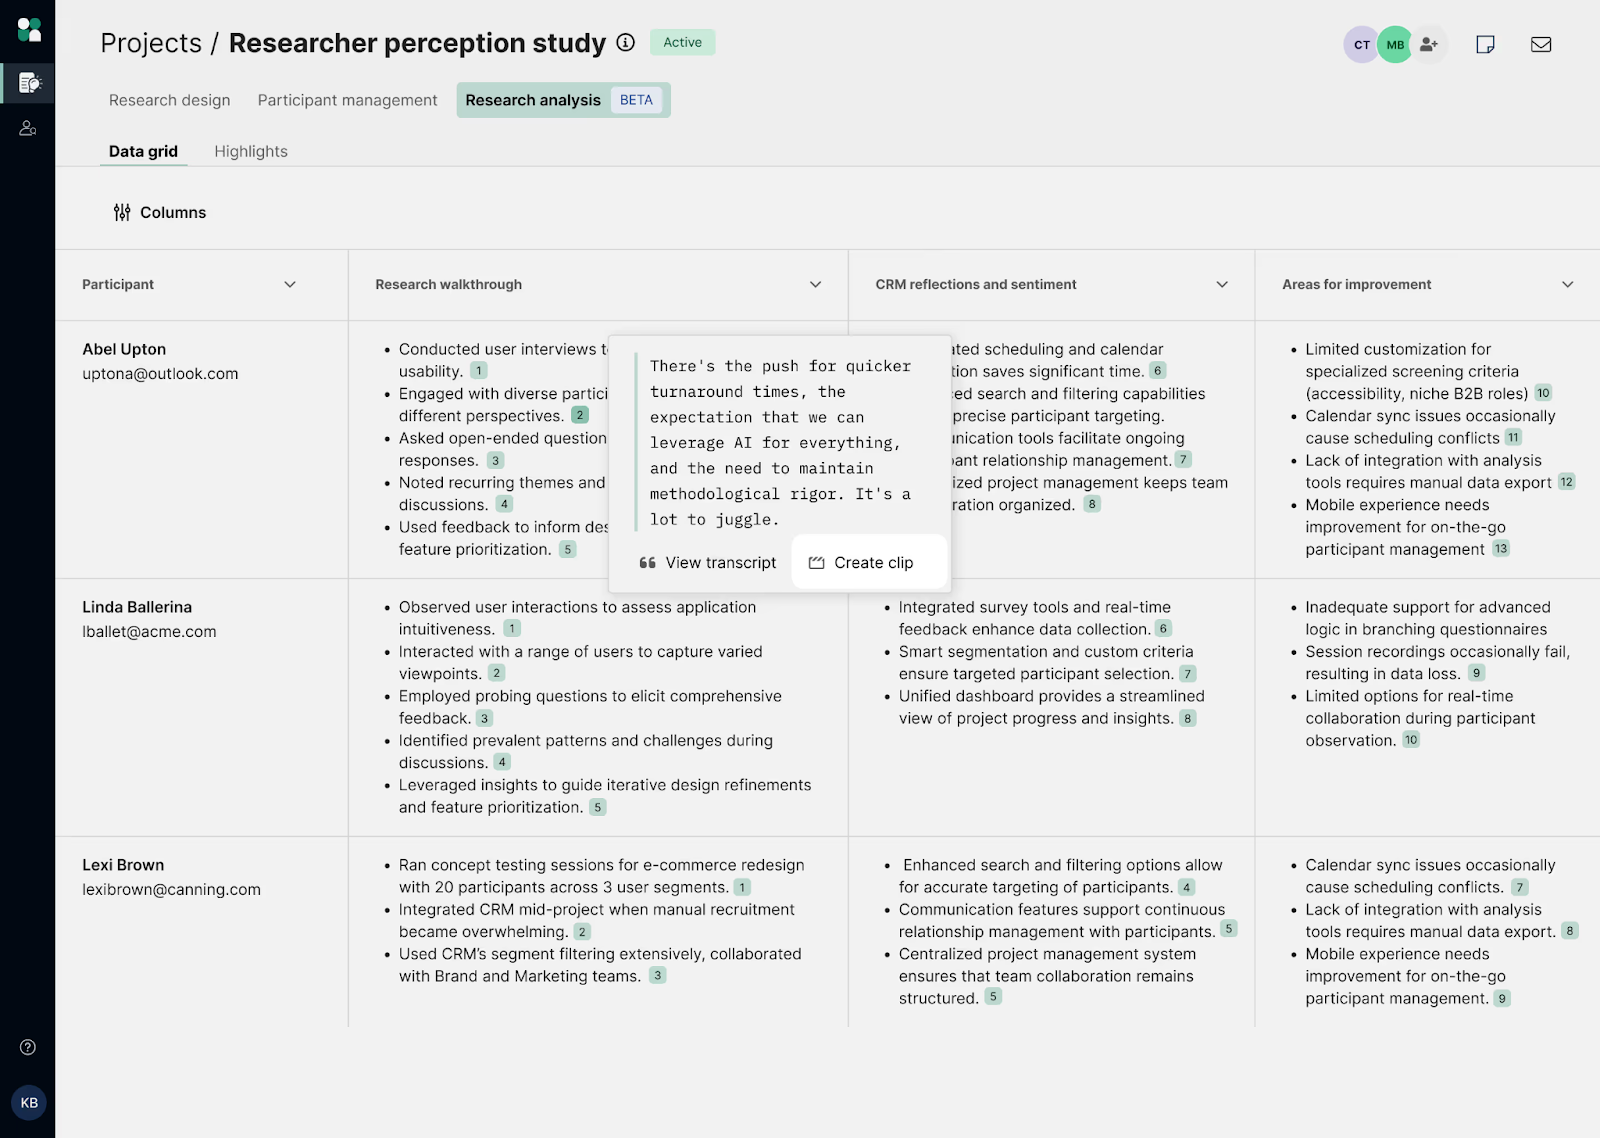
When you notice something interesting:
- Click the citation
- Review the surrounding transcript context
- Confirm tone and nuance before elevating it as an insight
- Create a clip to save and share with stakeholders
Note: One of the most powerful features of the Data Grid is the one-click copy function. You can copy an observation, automatically include citation details, and retain deep links back to the transcript. This makes it easy to share supporting evidence and confidently “show your work.”
Exporting your data grid
While many teams complete analysis fully within User Interviews, there are times when exporting makes sense.
You may want to export the grid if you:
- Prefer to conduct additional analysis in spreadsheets
- Need to share findings outside your User Interviews workspace
- Are importing results into a repository tool
- Want to build pivot tables or quantitative summaries
How to export the data grid as a CSV
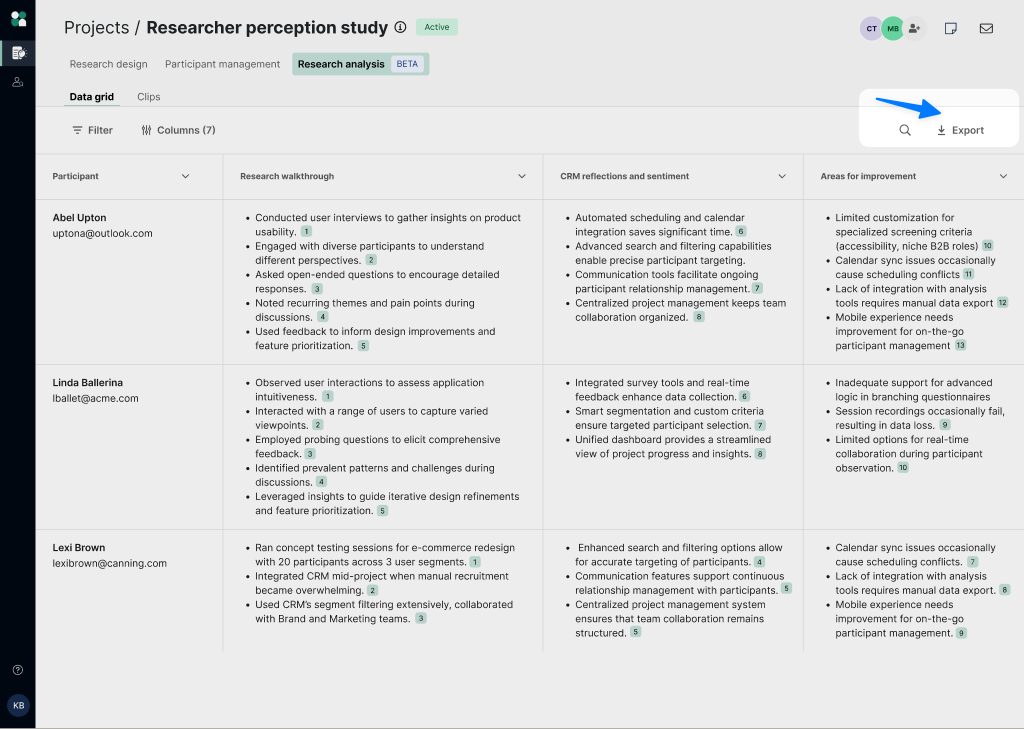
Exporting is simple:
- Navigate to the Data Grid tab in your workspace.
- Use the dropdown to select “Export.”
- Download the generated CSV file
The CSV export includes:
- Participant name
- Participant email
- All AI-generated observation columns (based on discussion topics)
Currently, exports do NOT include:
- Screener responses
- Custom participant fields
- Citation links
This keeps the export streamlined while preserving structured observations for further work.
Ultimately, the Data Grid is where your research transitions from “individual conversations” to “cohesive insights.” It removes manual comparison work while keeping you grounded in real participant evidence. It helps you move faster, without compromising rigor.


Creating Clips